Data Analytics
Boston Winter Climate Analysis
See it on GitHubAnalyzed ten years of NOAA weather and ocean data to explore relationships between Boston snowfall, air temperature, and ocean temperature. Cleaned and aggregated raw data with Python and created interactive visualizations in Power BI.
Project overview
About the project
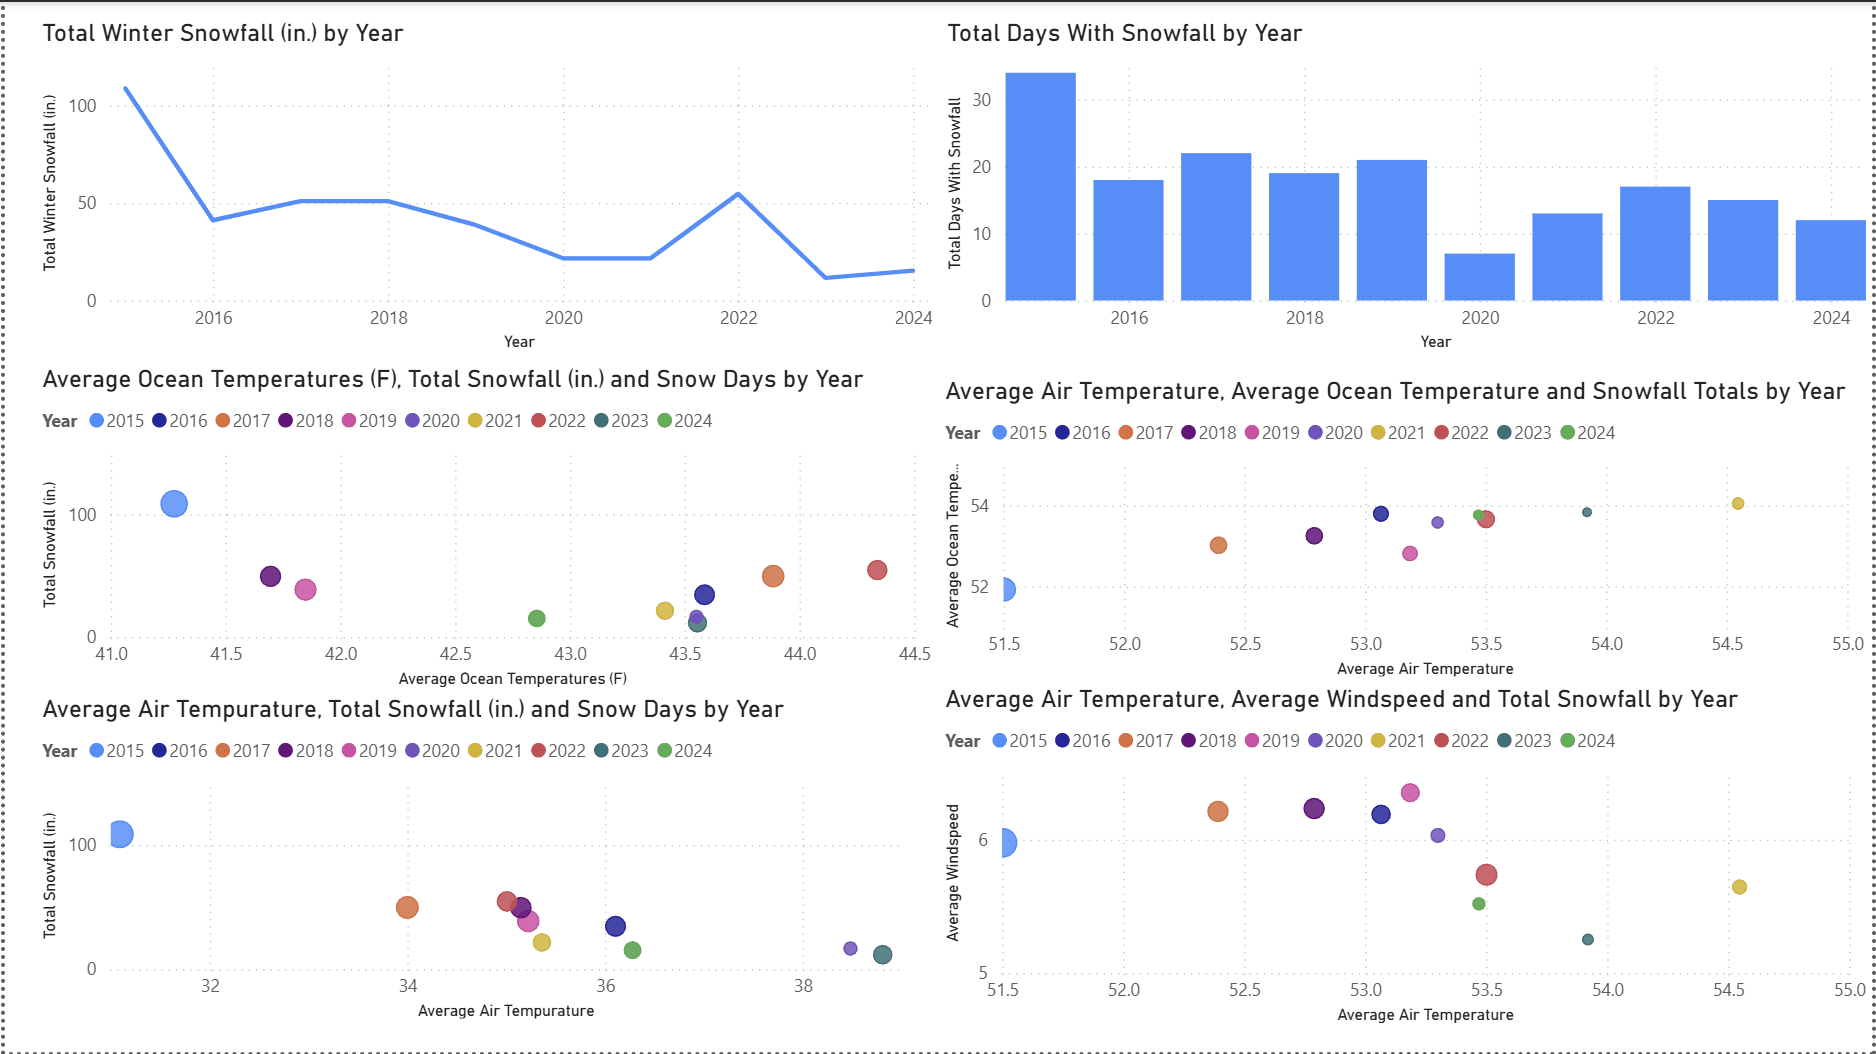
This project examined how Boston's winter snowfall patterns changed from 2015–2024 and whether those changes were associated with air and ocean temperatures. Using historical NOAA data from Boston Logan International Airport and offshore buoy 44013, I compared snowfall totals and snow-day frequency with temperature patterns across ten winter seasons.
Independently collected, cleaned, and analyzed the datasets using Python and Pandas. Created yearly winter statistics and visualizations in Power BI to identify trends and relationships within the data.
The two NOAA datasets were structured differently. Buoy measurements were recorded hourly while the land weather data was daily, and the buoy data also contained missing values. The datasets needed to be cleaned and standardized before they could be compared.
Cleaned missing values, converted and aggregated hourly buoy measurements into daily averages, and merged the land and ocean datasets by date. The resulting dataset was used in Power BI to visualize snowfall trends and relationships between temperature and snowfall.